Monitoring with Exometer: An Ongoing Love Story
Welcome, friends, to the first AdRoll tech blog of 2014! Last night AdRoll hosted Erlounge here in our Mission street offices; seventeen Erlangers showed up and three talks were given. Juan Puig of Linden Labs gave a lightening tutorial on the use of quickcheck in Erlang, the slides of which you can find here. Marc Sugiyama of Erlang Solutions–boy, they have nice business cards–spoke about debugging techniques in long-lived Erlang systems. To my knowledge the slides aren’t yet online, but if you can corner Marc at a conference do so.
As I completely spaced on getting these talks recorded–sorry, next time–I present my slides with comments interspersed.
For my part, I spoke about the Real-Time Bidding (RTB) monitoring effort I’ve been leading here at AdRoll and, in particular, the role of Ulf Wiger and Magnus Feuer’s exometer library in this work.

The dirty thing about monitoring is that it’s tangential to value-added work. It provides no direct value to customers and is, well, expensive. Now, that’s not to say monitoring isn’t important. It is. What we’re looking to do here is safeguard our investments: investments in engineering time, customer acquisition, in computing hardware and human life. (Happily, AdRoll doesn’t have the responsibility of life and death, but we can engineer our systems to waste people’s time, which they’ll never get back.) Monitoring complex systems is playing the game of keeping ahead of work-stopping disaster. (Incidentally, I highly recommend Charles Perrow’s Normal Accidents: Living with High-Risk Technologies and Eric Schlosser’s more recent Command and Control: Nuclear Weapons, the Damascus Accident, and the Illusion of Safety if you’d like to read more in-depth on this subject.)
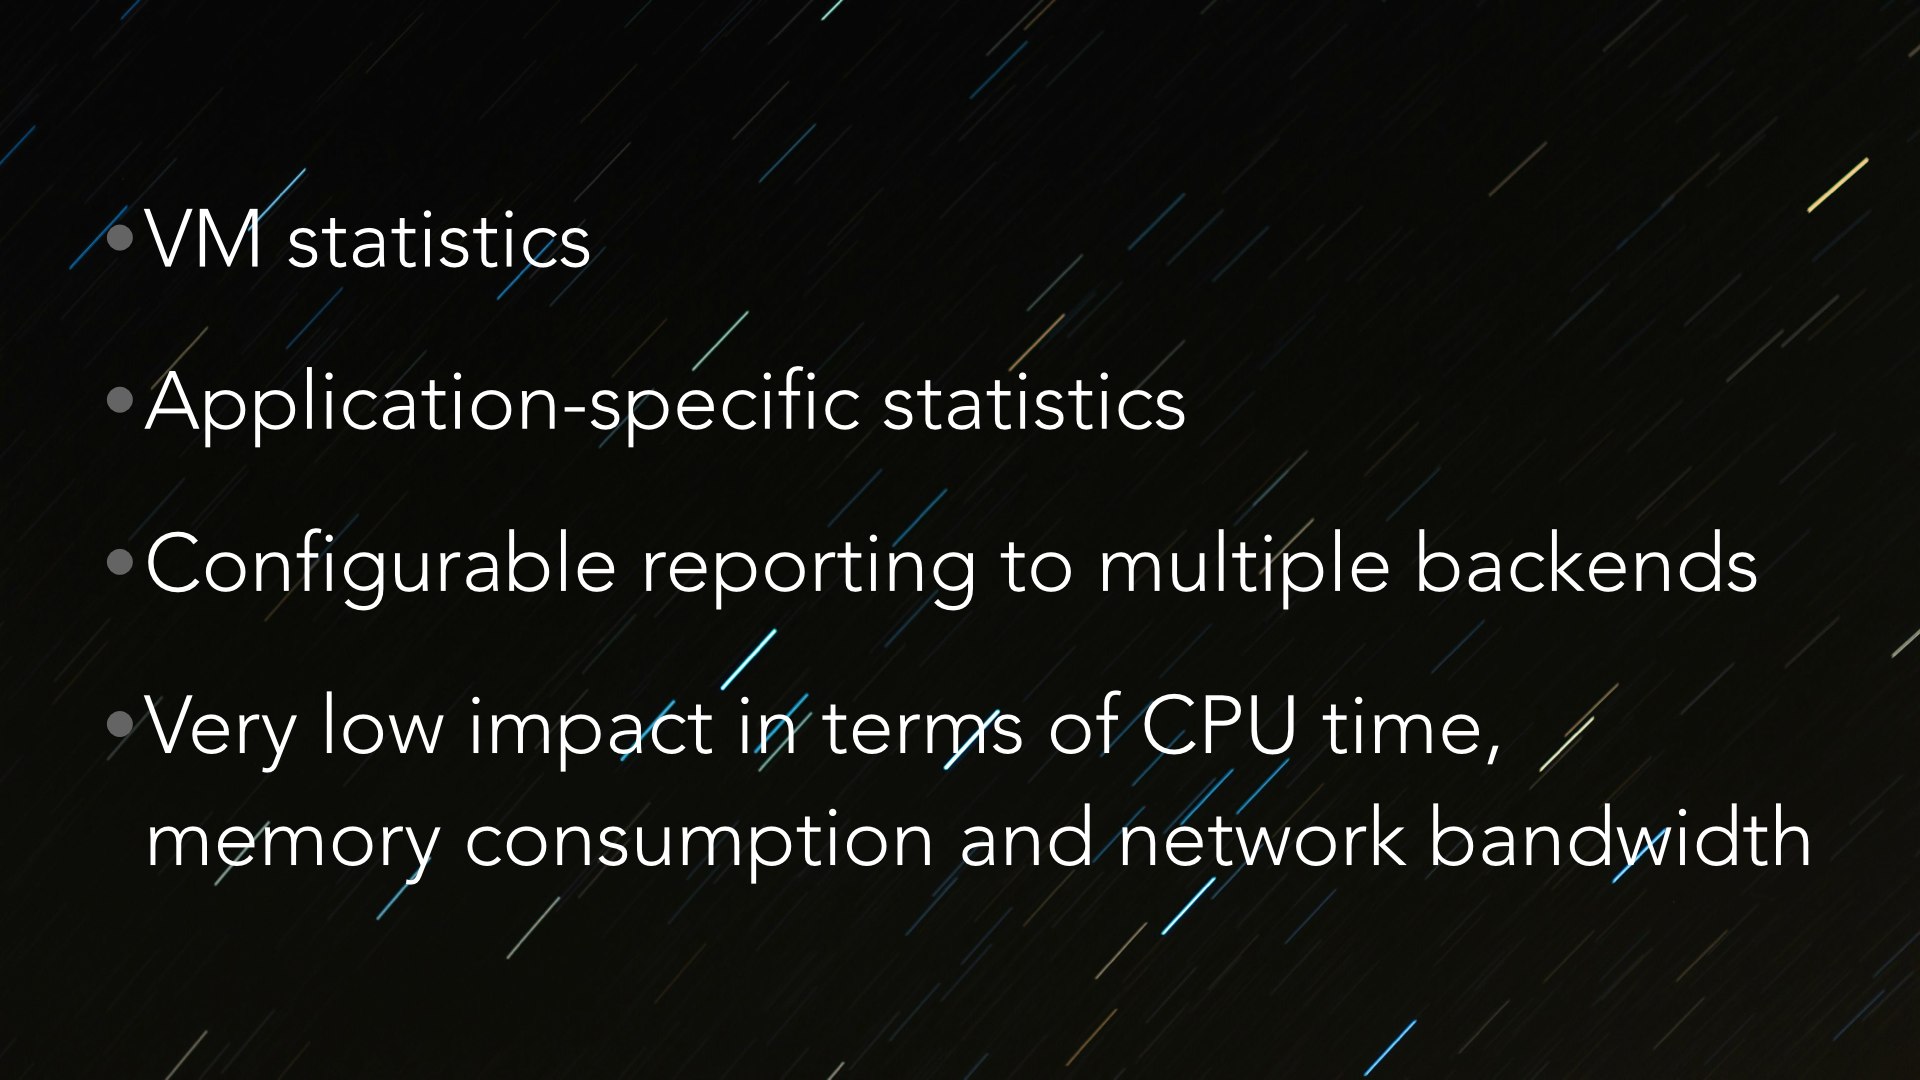
In our Erlang systems we’re on the look-out for two things primarily: red-line VM statistics and metrics that say our applications have gone sideways. Any system that’s going to help us monitor these things has to report to multiple backends–meaning, I need to pump data through our sophisticated Big Data pipeline which I barely understand, out to on-disk logs and to our metrics aggregation partner, DataDog, via their statsd client–and cannot introduce excessive overhead into the systems.
The RTB system, for instance, handles approximately 500,000 bid events per second and must respond to each one, without fail, in 100 milliseconds. Let that sink in for a bit. A few days ago we peaked 30 billion bid events in a single day. Let that sink in. Any monitoring library we use is going to have to keep up with that load and, as few people have that load to play with during development, needs to be hackable enough for us to make changes. This implies the authors have to be friendly and open to patches and blind “uh, I dunno, it just doesn’t work” issue tickets.

We know what we need from a system–the ability to track two kinds of statistics, configurable reporting and low-overhead–but what is it we’re spending all this time building to avoid? What are the disasters inherent in the system?
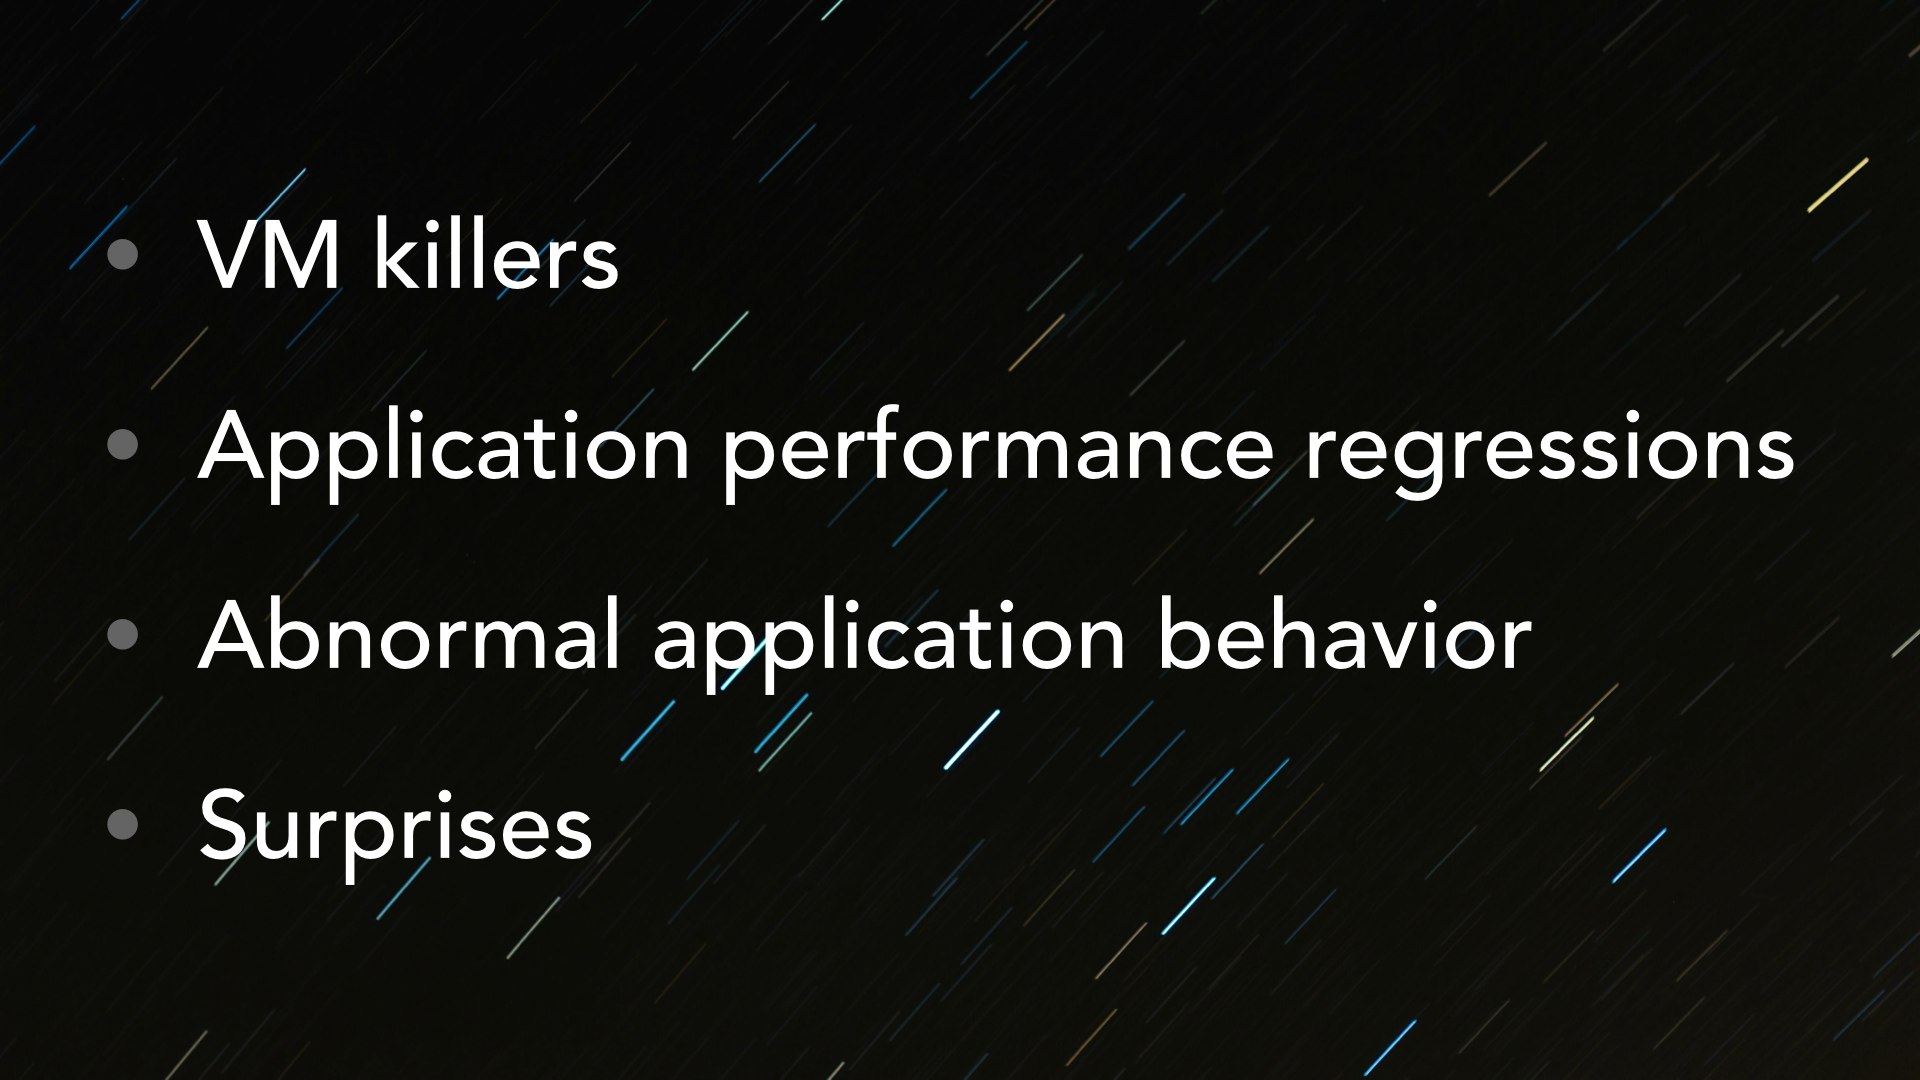
There’s the usual suspects of VM killers: atom tables that hit the max, hitting max processes or ETS tables. Monitoring these is a matter of going through the System Limits documentation a few times so you know what you’re up against. More difficult, if only because it requires the intrinsic knowledge of the system engineers, are identifying performance regressions–what’s the benchmark, anyway–and ‘abnormal’ behavior. What’s abnormal? Usually they’re identified after the fact but smack you right in the face once they show up. For instance, it’s possible to bid millions of dollars for individual ad slots. Exchanges don’t provide much validation of bids except to assert that they’re well-formed. Bidding without a safety net means opening yourself up to the possibility of blowing through your company’s entire budget in a few minutes.
When something goes wrong at 500,000 bids a second it goes wrong real fast.
That’s where the general class of “Surprises” comes in. Insight into such a monstrous system is hard-won and safety-nets are specific to the class of problems you were able to anticipate or have survived. Effective monitoring gives engineers a chance to examine the live system and discover behavior they didn’t expect to create. Some of the unexpected behaviors are good and you codify them, others are disasters waiting to happen and you dutifully fix them before it comes to tears.

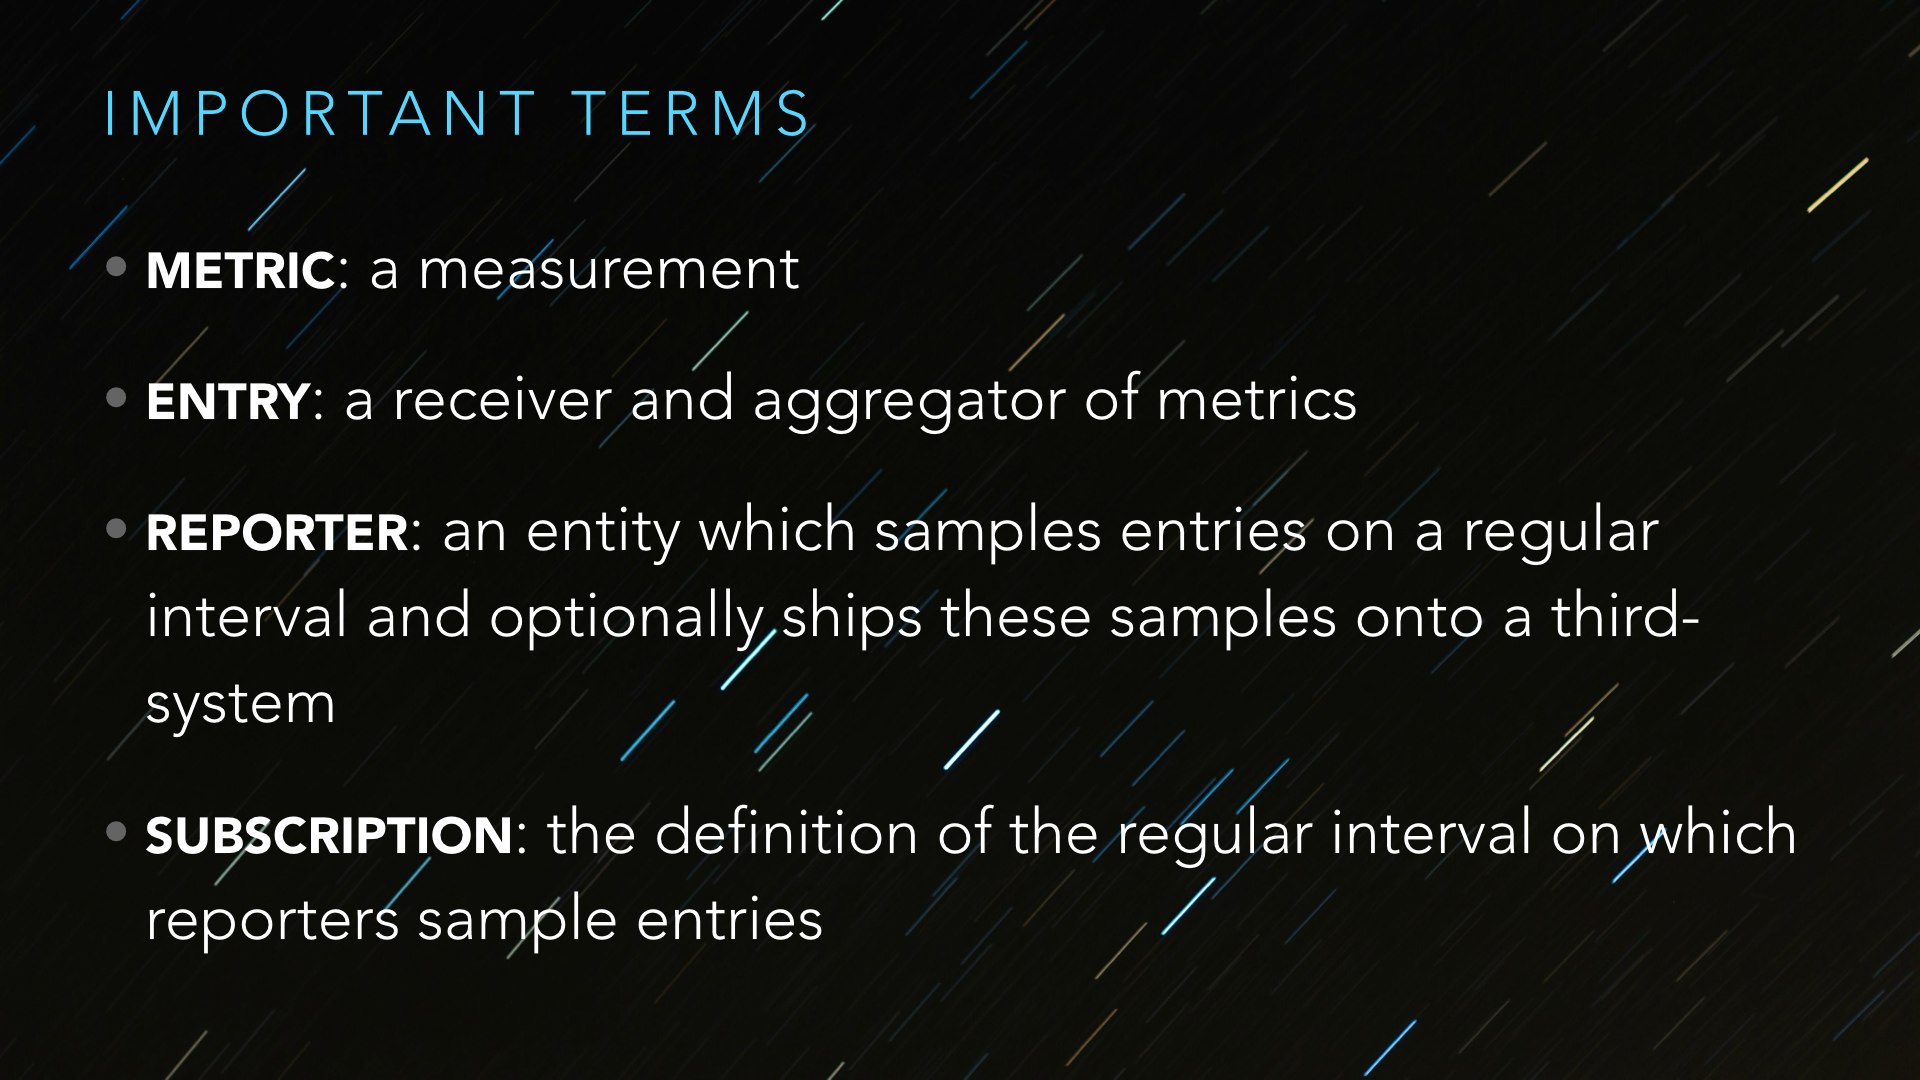
Like I said, we’re using exometer and it’s very easy to get started yourself. First, it’s important to understand exometer’s terminology about itself as it’s a bit unlike any of the other monitoring libraries available for Erlang.
An “entry”, as the slides say, is a “receiver and aggregator of metrics”. Consider the histogram entry. You stream number metrics into it–maybe Erlang messages per second–and the histogram entry will build a histogram of this data, discarding the original numbers as needed. A “reporter” is a exometer entity capable of taking values from entries and shipping them elsewhere, across a network in the case of the statsd reporter or, say, to your TTY. The “subscription” defines how often a reporter–or reporters–will take values from which entries and ship them off.
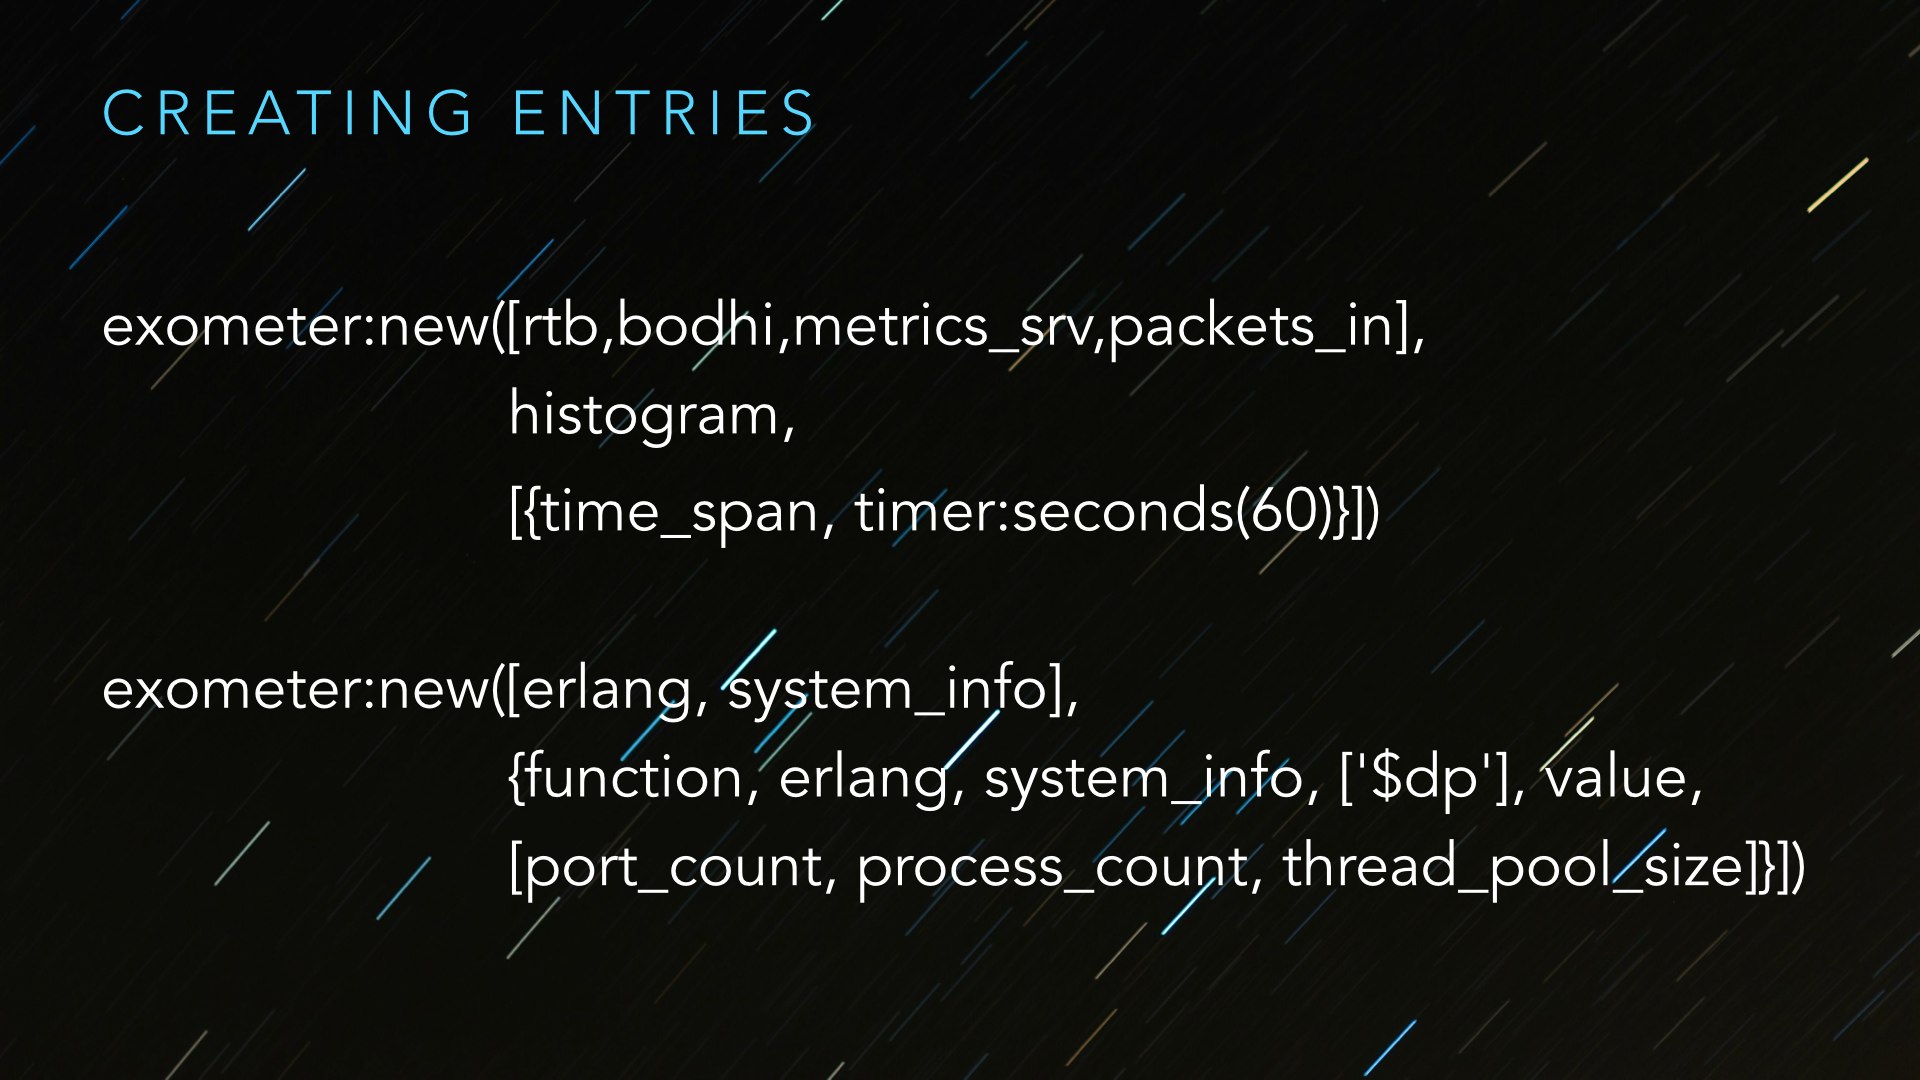
As of this writing, entries are created dynamically. Here we’re creating the [rtb, bodhi, metrics_srv, packets_in] metrics–which is a histogram whose values expire after 60s–and a function entry. The function entry exometer supplies is brilliant. Let’s break it down:
- The exometer application will create an entry which calls
erlang:system_info/1and - this entry will have four ‘values’:
port_count,process_count,thread_pool_size. - These values will be be fed, by name, into the entry function so the metric of the entry will the the result of
erlang:system_info(Value)at inspection time.
For instance, on one of our systems so instrumented, I find that:
> exometer:get_value([erlang, system_info], process_count).

1065
Function entries mean that exometer natively supports application specific and VM specific metric gathering; it’s all just a matter of finding the right functions to call. Even more brilliant, exometer supports a mini-language to slice and dice function returns as needed because, remember, exometer entries are number based. You’ll have to inspect the inline source documentation to learn more.
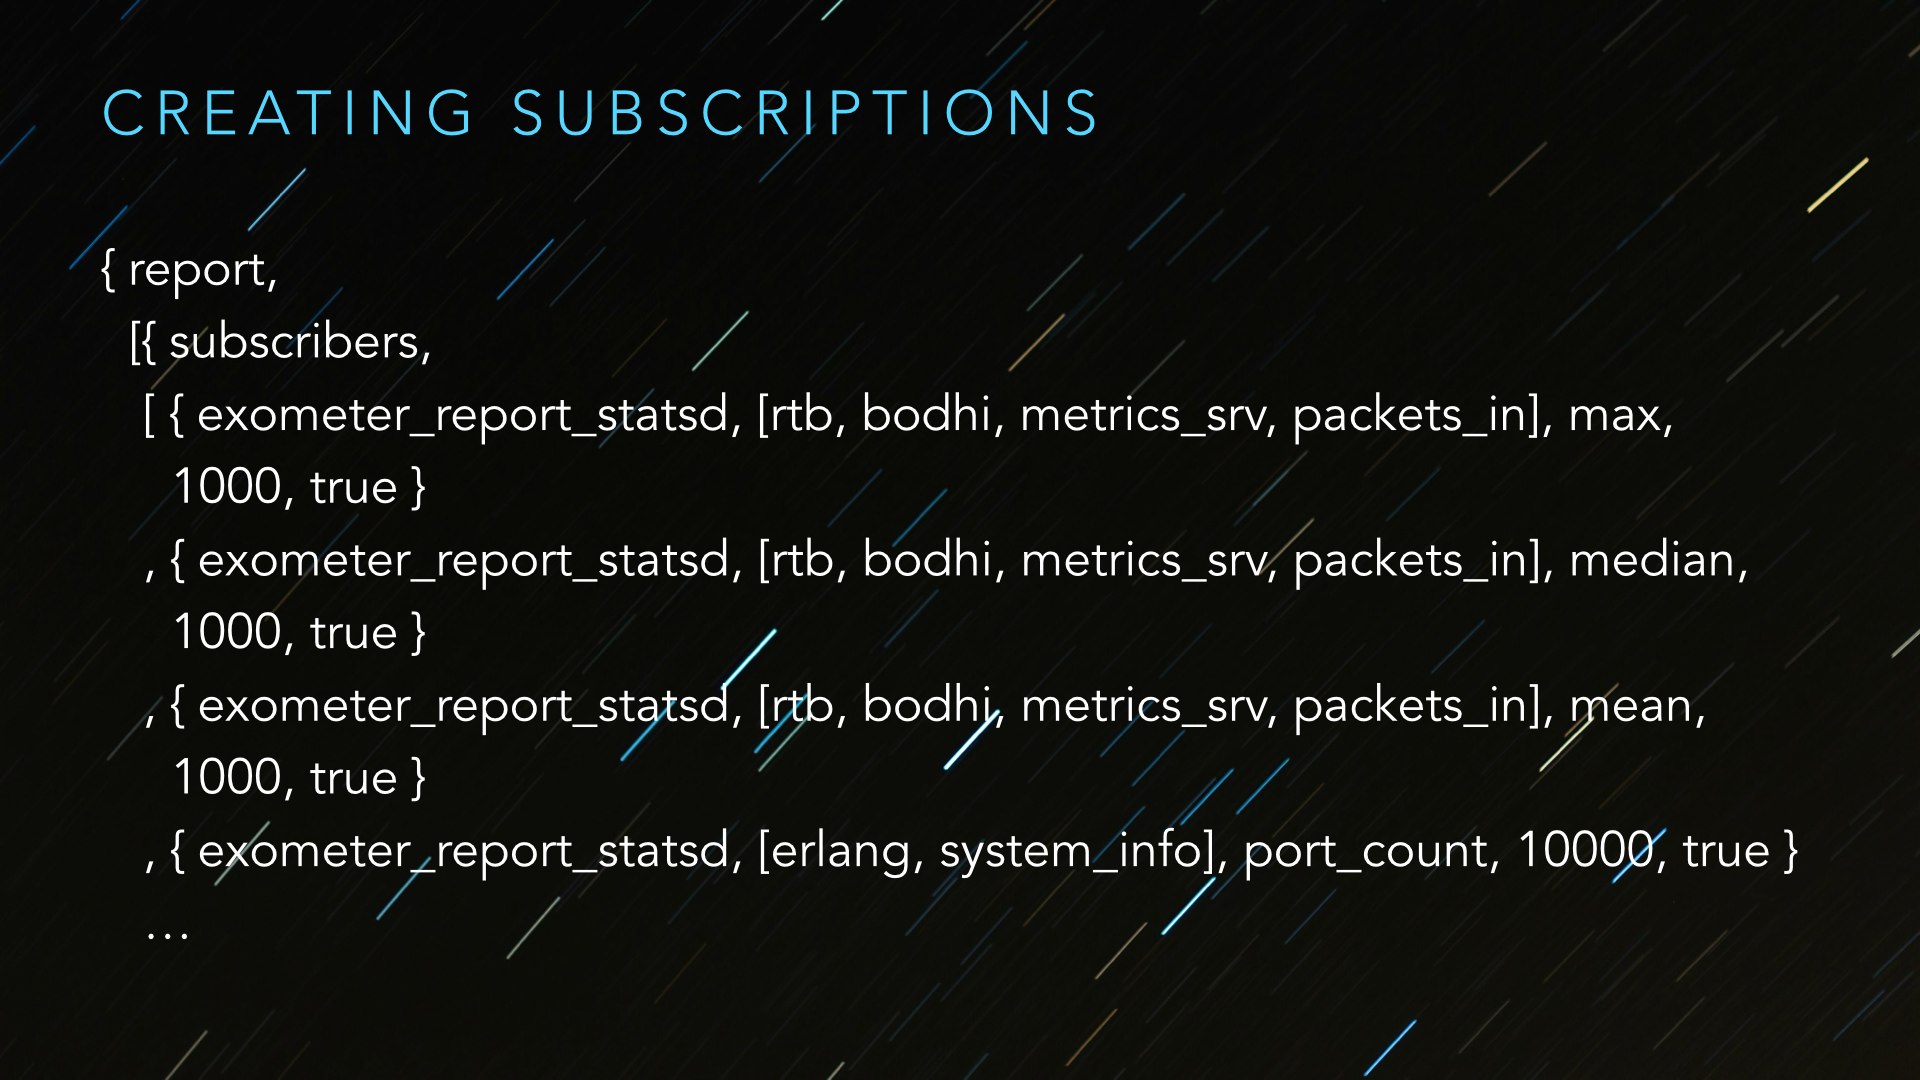
Subscriptions are statically configured in exometer’s application configuration. Here’ we’re creating four subscriptions: three for the [rtb, bodhi, metrics_srv, packets_in] histogram and one for the [erlang, system_info] function entry. The values of the tuple, by index, are:
- The reporter we’re subscribing to an entry, here
exometer_report_statsd, - the “entry name” which matches that supplied in the entry’s creation,
- the “entry value” of which
max,medianandmeanare stock for histograms while we created theport_countvalue for the function entry, - the rate on which the reporter will poll the entry for values, in milliseconds and
- a “retry” flag which is sort of a workaround for races between entry and subscription creation. (Consult the docs but set this to true.)
What we’ve got here now are entries collecting metrics and subscriptions to get them shipped off to other–possibly multiple, depending on how many reporters you configure–locations. All that’s left is configuring the reporter.
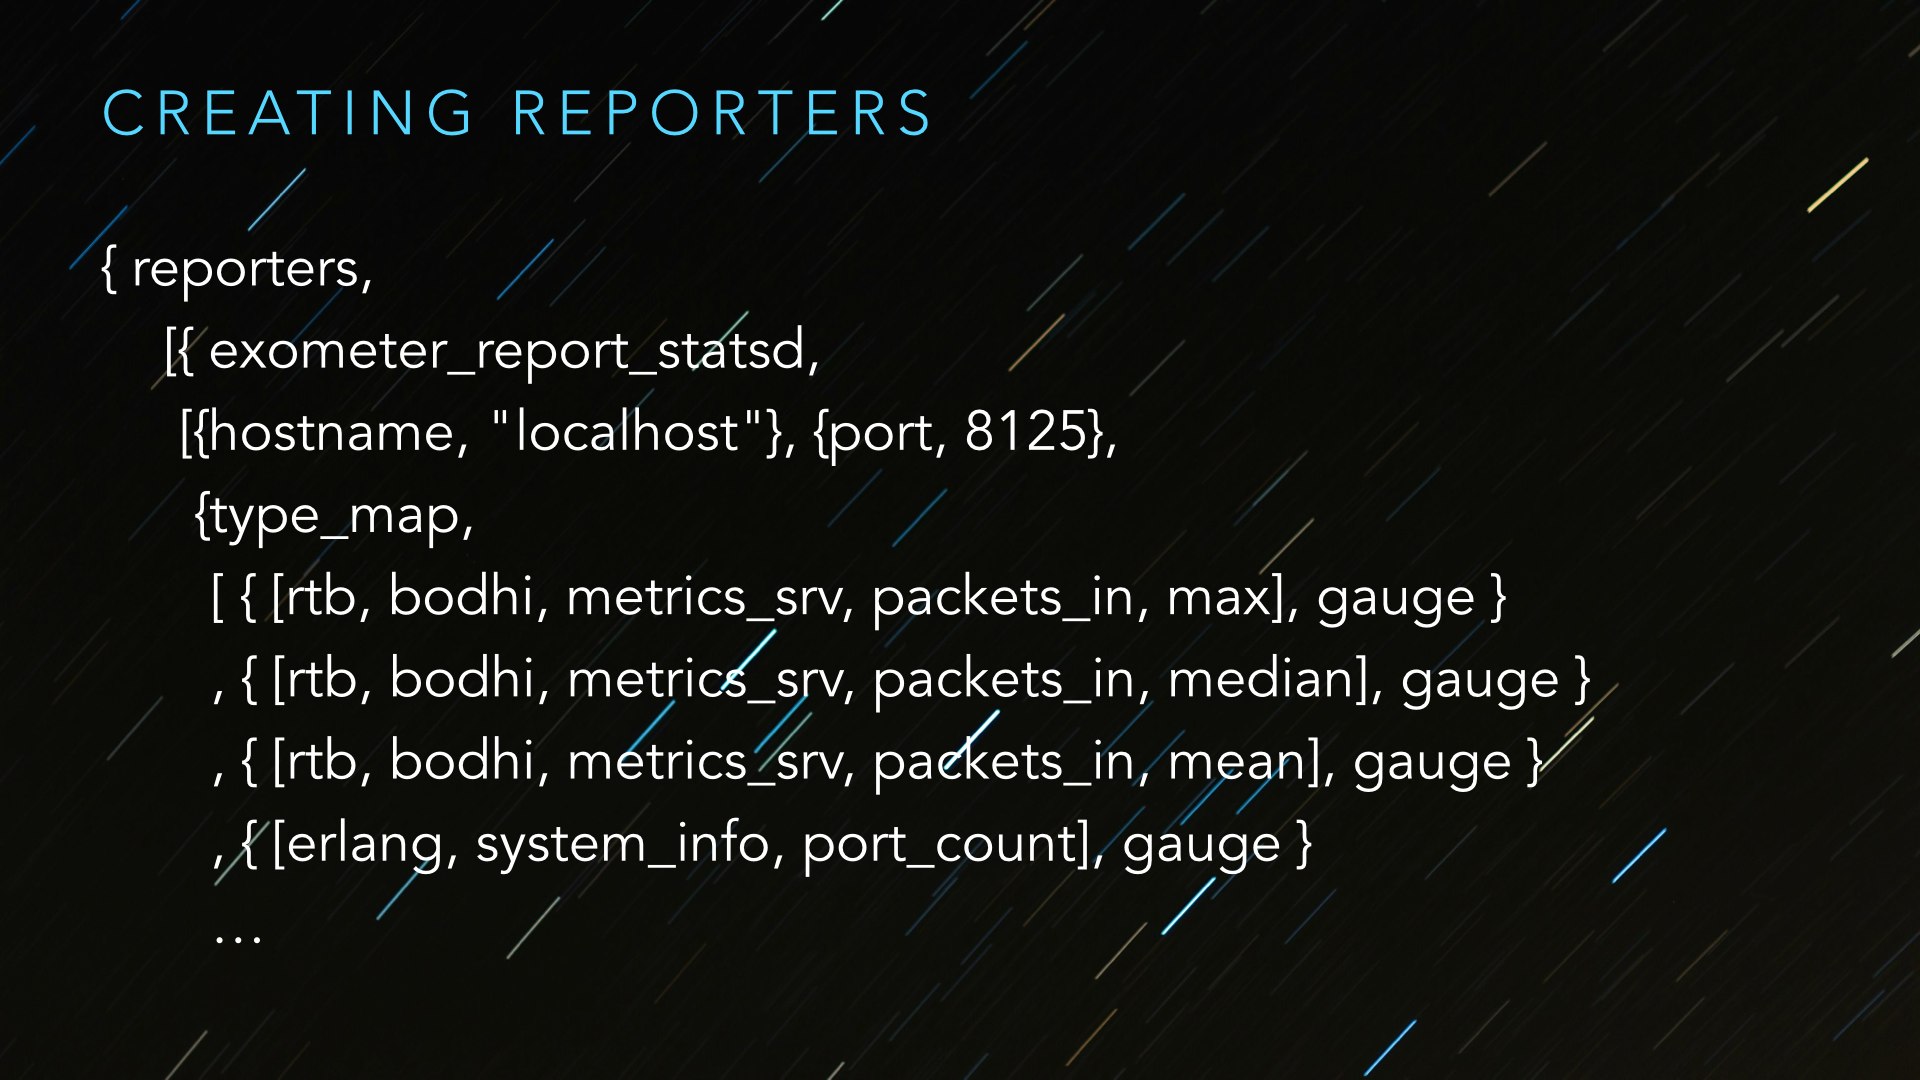
Reporter configuration is also, itself, statically set in the exometer application configuration. This is terrifically nice in the face of exometer application restarts, made somewhat less effective by the purely dynamic creation of entries. (Static all the way through is under discussion.) Above we’re just defining the network location of our friendly statsd daemon and none of that should be terribly surprising. What is worth pointing out is the type_map. Exometer entries have no knowledge of the systems they’ll eventually be reported to and, as such, carry no information about their ultimate coercion. The reporter is the point of integration for this information.
Statsd has the following native aggregation types (which exometer would call an “entry”):
- gauges
- counters
- timers
- histograms
- meters
You can read more here. You can see in the above that I’m shipping everything over as a ‘gauge’, including entries which exometer is storing itself as a histogram. I’ll come back to this shortly.
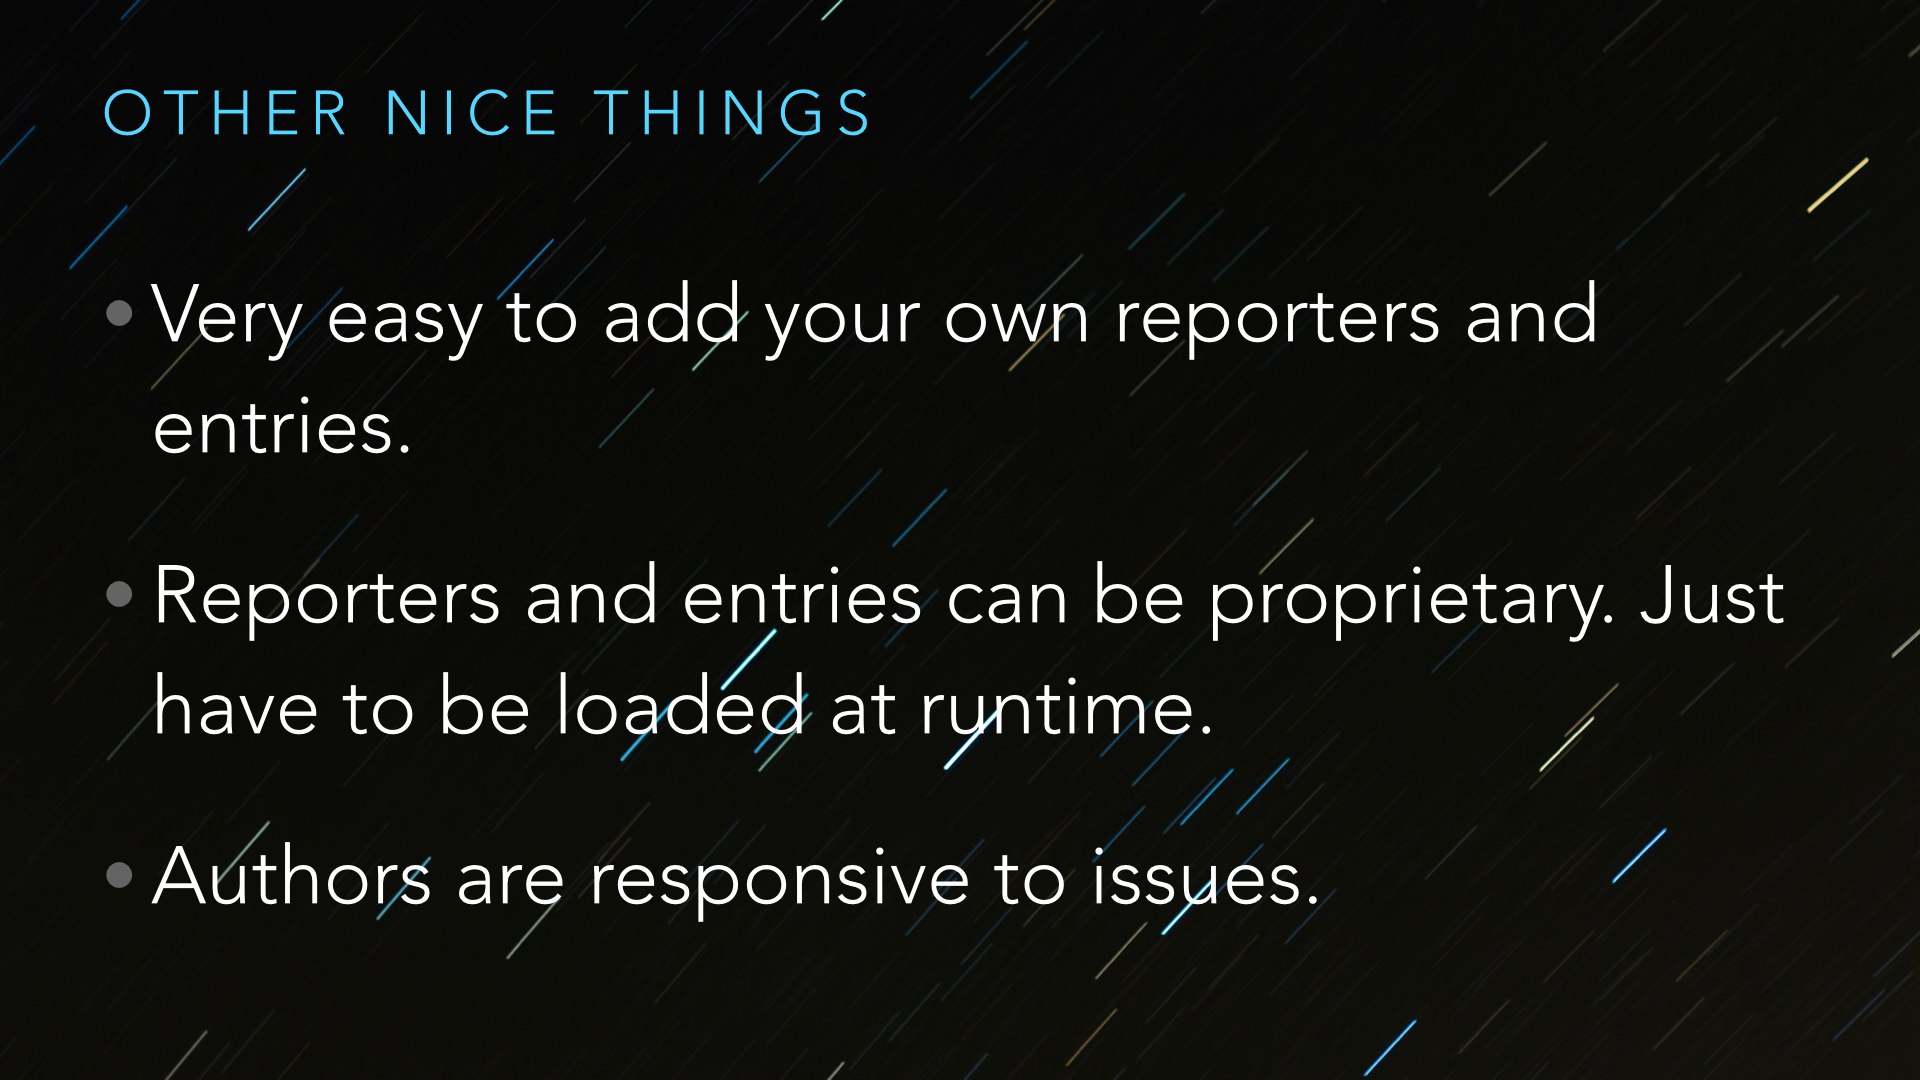
A side benefit, which you may have noticed, about exometer is that it’s extremely configurable even to the point of totally avoiding its stock reporters and entries. When I developed exometer_report_statsd I did so by ensuring that the module was loaded by the code-server ahead of exometer being started and configured exometer to report into that module. Non-default entries can be slipped in similarly via configuration to the exometer_admin module. I haven’t done this yet–it’s on the schedule for two sprints from now–but it looks straightforward enough.
Exometer is configurable enough to the point of supporting your goofy, one-off reporters without having to fork the library yourself. That is remarkably handy when you need it.
I would also be remiss if I didn’t point out that Ulf and Magnus have been extremely helpful and responsive to my needs: long email questions have received detailed answers, non-trivial issues have been worked promptly and they’ve been receptive to the (admittedly meager) code I’ve contributed upstream so far. I can’t thank them enough.

There are other monitoring libraries, better known and more venerable. Why did we not choose to use them?
- A lack of built-in reporters, to use the exometer term, is killer. Folsom deployments tend to carry around bespoke code to pull metrics out and route it around, with various degrees of reliability.
- A lack of multi-reporting, in addition, unless you build that.
- A relative lack of flexibility in adding new entry types.
- A lack of ‘function’ entries, which are super handy for dealing with VM statistics.
- A lack of configurable polling periods for those projects that do ship with limited reporting.
None of the other projects are totally lacking in all of the above, but each is just enough to be problematic. Those that are venerable tend to be slower to change, naturally.

If exometer is so great–and it is, go use it–then what are the downsides?
Remember earlier when we created a histogram entry but then configured our reporter to pump out select values as statsd gauges? Why is this? Well, statsd assumes that it will receive the stream of numbers along with a bit of metadata that assigns an aggregation type to it. Exometer assumes that it will have this responsibility. As there’s no way to just push the state of a histogram into statsd wholesale we fake it by pushing key points over. The statsd ‘gauge’ is the only statsd type that assumes its “calculated at the client rather than the server”. Honestly, I’m not sure how to resolve this. I did make an issue for it.
As of this writing, there’s a serious space-leak in the histogram entry. This is being actively worked on. (Update: looks like this is resolved. Fun!)
I pointed out above that both subscriptions and reporters can be statically configured. Entries, however, cannot be. There’s an issue for that.
There are some reports that exometer won’t compile under R16B03 due to an erl_syntax bug, but I believe this has been resolved.


