Managing DynamoDB Autoscaling with Lambda and Cloudwatch
Autoscaling was a great addition to DynamoDB and it lets you forget about assigned capacity. Here’s how we implemented our own algorithm to improve on this idea.
10-15 minute read
DynamoDB is a NoSQL key-value database service provided by AWS. We use it at the core of many of our systems, since the consistent read latency is awesome for realtime applications. If you are not entirely familiar with it, it might be worth refreshing the basics with the AWS Documentation
One of the first things you learn as a new DynamoDB user is that you have to manage your table capacity in order to keep both your needs and costs in check, which can be harder than it sounds. DynamoDB tables and indexes offer 2 core metrics that you can use to achieve this: provisioned and consumed capacity.
Initially, the only way around this problem was to assign the capacity manually, based on experience and traffic. If your traffic varied, you ended up having some margin to absorb variations, which leads to wasted capacity. Eventually, DynamoDB ended up introducing an autoscaling feature, which lets you set a relation of consumed to provisioned capacity, up to 70%. This means that if you set your table for 70% and you consume 7 units, you’ll get 10 provisioned units.
Problems we faced with the default autoscaling algorithm
The default autoscaling algorithm provided by AWS works by setting up a series of alarms that trigger if the capacity is above the defined rate for more than 5 minutes (please visit the docs for autoscaling if you are interested in the details).
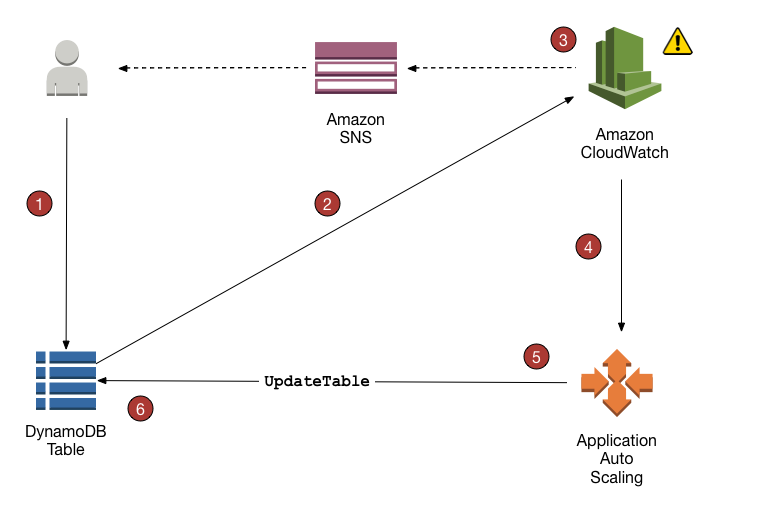
This poses a problem for an application with varying and bursty workload: the table will scale up only based on consumption, triggering these alarms time after time, until it reaches the desired level. Ideally, the table should scale based on the number of requests that we are making , not the number of requests that are successful. Additionally, at the time of implementing this algorithm, the DynamoDB capacity could not be brought down automatically if the consumption was exactly zero, which can happen if you write to your table in batch instead of realtime, for example.
From the AWS docs:
` Currently, Auto Scaling does not scale down your provisioned capacity if your table’s consumed capacity becomes zero. As a workaround, you can send requests to the table until Auto Scaling scales down to the minimum capacity, or change the policy to reduce the maximum provisioned capacity to be the same as the minimum provisioned capacity. `
This meant that, when enabling autoscaling, tables that were read in realtime, but written to in batch, still needed manual intervention to bring the write capacity down after our jobs were done writing. Gladly, the DynamoDB team has recently fixed this issue, so at the time of writing, tables now downscale on their own. DynamoDB tables also have a hidden reserved burst capacity metric, which can be consumed to absorb traffic spikes (but it’s also at the disposal of DynamoDB for internal operations. More on that here). Another interesting point that might bite users is that capacity decreases are an expensive operation for AWS, so they’re limited.
From the AWS docs:
` For every table and global secondary index in an UpdateTable operation, you can decrease ReadCapacityUnits or WriteCapacityUnits (or both). The new settings do not take effect until the UpdateTable operation is complete. A decrease is allowed up to four times any time per day. A day is defined according to the GMT time zone. Additionally, if there was no decrease in the past hour, an additional decrease is allowed, effectively bringing the maximum number of decreases in a day to 27 times (4 decreases in the first hour, and 1 decrease for each of the subsequent 1-hour windows in a day) `
The number of decreases cited in the documentation can be achieved under very special conditions, since you need to have 4 decreases in the first hour of the day plus one for each of the remaining hours, for a total of 4 (first hour) + 23 (1 hourly) = 27. As you can imagine, getting to this number is rare and not entirely efficient. You can read more about these limits here
Initial approach
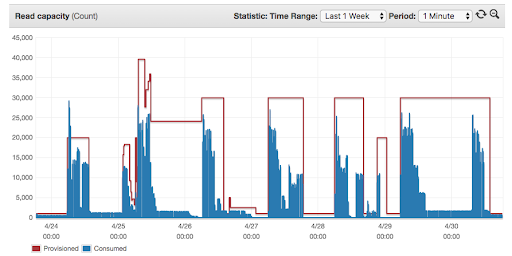
Our initial approach was to manage capacity as fixed steps for batch loads:
-
Fixed step for read capacity
-
Fixed step for write capacity
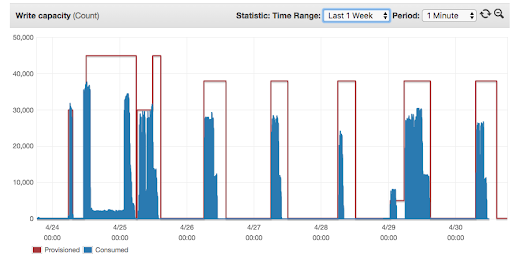
While this is better than keeping the capacity up the whole time, you’ll realize that a lot of the time the assigned capacity is greater than needed and that it doesn’t go down as fast as it should. This led to an acceptable performance for the batch writes, but at the cost of limiting our options on when to run the jobs. As we started adding more jobs to the mix that either wrote to or read from these tables, we started to need this to be managed automatically.
Helping the autoscaling algorithm
We really wanted to use autoscaling for these tables, as the step increase was too wasteful. We came up with an idea to add a lambda function that would run every 5 minutes to check if tables were on the “0 capacity consumed state” for at least a few minutes, and bring the capacity down if that was the case. We were finally able to use the stock algorithm for these tables at this point, which led to a nice cost drop.
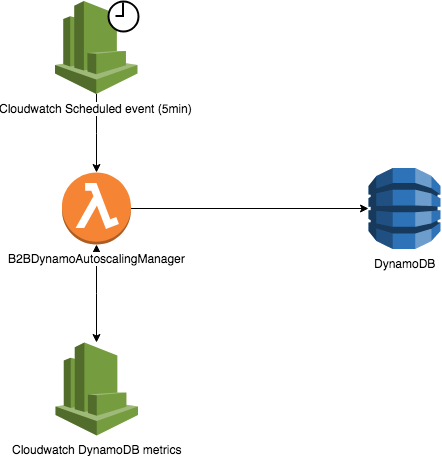
However, we still had the issue of tables rising capacity very slowly and not really paying attention to the amount of requests that were being rejected. This caused some of our operations (for example a full daily scan, or millions of requests for a batch job) to take hours of EMR/EC2 time.
Replacing the autoscaling algorithm
Finally, building upon the lambda idea, we decided to replace the autoscaling algorithm entirely. We designed a new version of the autoscaling lambda that uses tags and consumed and provisioned metrics like the last one, but that adds a new type of metric: the throttled requests.
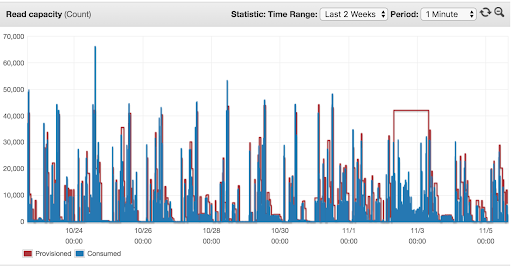
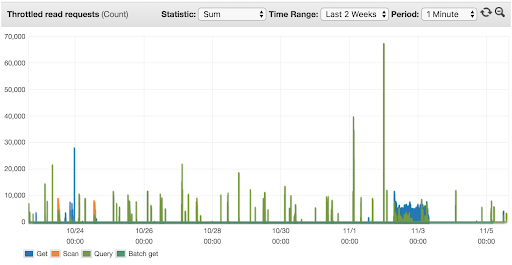
Under normal conditions the algorithm works exactly the same as the normal autoscaling algorithm. When throttling is present, the response of the algorithm is to increase capacity more aggressively, at fixed steps (we plan to make this proportional soon!). Additionally, this algorithm works differently in the case of increases and decreases, which plays a little bit better with the limited decreases during the day. While 27 decreases seems like a lot, the stock algorithm will lower the capacity as soon as the threshold is met, which can happen several times over the course of a few hours.
- Managed autoscaling for read capacity and how it relates to throttling
- Managed autoscaling for write capacity and how it relates to throttling
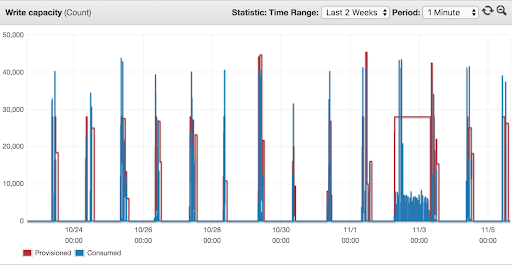
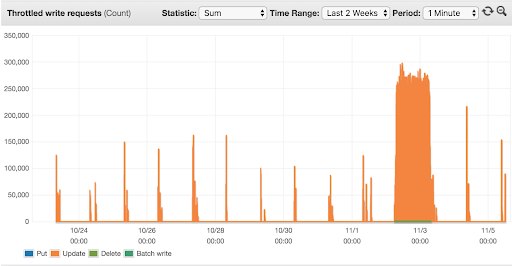
Here is where we detected our costs for our batch tables dropping to around 30% of the initial cost.
Example algorithm
The algorithm we are implementing for the autoscaling lambda is fairly simple and written in Python 3, using boto3.
First, we use the tagging client to figure out which tables we want to target:
response = resource_groups_tagging_client.get_resources(
    TagFilters=[{
        'Key': 'autoscaling_manager_enabled', 'Values': ['true']
    }],
    ResourceTypeFilters=['dynamodb']
)
table_names = ([item['ResourceARN'].split('/')[1]
               for item in response['ResourceTagMappingList']]
               if response['ResourceTagMappingList'] else [])
The tag system could be used to manage other parameters as well, for example max or min settings. Then, we make sure we are not stepping on a table that is using the AWS algorithm instead, using the application autoscaling client:
response = autoscaling_client.describe_scaling_policies(
    ServiceNamespace='dynamodb',
    ResourceId='table/{}'.format(table_name))
is_autoscaling_enabled = bool(response['ScalingPolicies'])
Once we have the list of tables, we retrieve their definitions and current setup from the dynamo client:
table_definition_and_settings = dynamo_client.describe_table(
    TableName=table_name)['Table']
Up to this point, we already know the structure of the table and its currently provisioned capacity, so we use the cloudwatch client to retrieve historic data from the past minutes about how the table is being used and how many requests have been throttled:
end_date = datetime.datetime.utcnow().replace(second=0,
    microsecond=0)
start_date = end_date - datetime.timedelta(minutes=5)
metric = cloudwatch_resource.Metric('AWS/DynamoDB',
    metric_name)
dimensions = [{'Name': 'TableName', 'Value': self.table_name}, ]
response = metric.get_statistics(
    Dimensions=dimensions,
    StartTime=start_date,
    EndTime=end_date,
    Period=60,
    Statistics=['Sum'],
)
data_points = {
    calendar.timegm(data_point['Timestamp'].timetuple()): data_point
    for data_point in response['Datapoints']}
metric_report = []
current_date = start_date
while current_date < end_date:
    current_timestamp = calendar.timegm(
        current_date.timetuple())
    sum_value = data_points.get(
        current_timestamp, {}).get('Sum', 0)
    metric_report.append({
        'timestamp': current_timestamp,
        'value': (sum_value / 60
            if metric_name
            in CAPACITY_METRICS else sum_value)
    })
    current_date += datetime.timedelta(minutes=1)
Some metrics are averaged per minute while others are absolute values, it took some experimenting to figure out how to match them to what we see in the DynamoDB UI. It’s also worth mentioning that we needed to fill the metrics that have a 0 value for consistency. There’s a chance that this is related to the issue AWS faced when decreasing the capacity for tables without consumption. Finally, we run a simple check over the collected metrics to decide if we need to change the table capacity. Keep in mind this is a simplified example that operates only on read capacity for the table:
currently_provisioned = current_settings['ReadCapacityUnits']
throttling_metrics = usage_metrics['ReadThrottleEvents']
average_throttling = (
    sum(record['value'] for record in throttling_metrics) /
    len(throttling_metrics))
consumed_metrics = usage_metrics['ConsumedReadCapacityUnits']
average_consumed = (
    sum(record['value'] for record in consumed_metrics) /
    len(consumed_metrics))
utilization = average_consumed / currently_provisioned  # This is the target utilization defined by the stock algorithm
can_increase_capacity = currently_provisioned < MAX_READ_CAPACITY  # We set a cap to keep the cost in check
target_provisioning = int(average_consumed * (1 / self.TARGET_UTILIZATION))  # Our target utilization is 0.8, higher than the original max value
min_provisioning = 5  # Arbitrary minimum

if average_throttling and can_increase_capacity:  # While throttling, we do quantized increases, with 2 fixed rates
    new_capacity_settings = (currently_provisioned +
        (self.HIGH_THROTTLING_CAPACITY_INCREASE
         if average_throttling >= self.THROTTLING_THRESHOLD
         else self.LOW_THROTTLING_CAPACITY_INCREASE))
elif currently_provisioned < min_provisioning or not average_consumed:
    new_capacity_settings = min_provisioning  # If we are below min or nothing is using this table
elif utilization > self.TARGET_UTILIZATION and can_increase_capacity:
    new_capacity_settings = target_provisioning  # This means we are a bit tight, so we increase to match 0.8
elif not average_throttling and utilization < self.BUFFERED_TARGET_UTILIZATION:
    new_capacity_settings = target_provisioning  # This means we are wasting some capacity, so we decrease it

if (new_capacity_settings and
    new_capacity_settings != currently_provisioned):
    # Proceed to update the table with the new settings
else:
    # Skip updating this table
While this code might be a little long to read, it’s pretty straightforward: it works exactly like the stock DynamoDB algorithm but it will increase the capacity aggressively by a fixed amount when there’s throttling involved.
Please check this gist for the complete implementation, including write capacity and GSIs support! Keep in mind that the fixed steps for throttling suited our needs, but a proportional approach could be used with any table workload. Another improvement would be to support multi region tables (right now, most of our tables are in one region).
If you want to give it a try, you’ll have to create a lambda function with the code from the gist, and set up a cloudwatch rule to trigger the function periodically, every 5 minutes.
You should make sure that the role you use in the lambda has the following permissions enabled:
- Read / Write permissions on the DynamoDB tables you want to test
- Read permissions on Cloudwatch
- Read permissions on Application Autoscaling
- Read permissions on Resource Groups Tagging
Once you’ve set everything up, the only missing piece is adding the autoscaling_manager_enabled=true tag to your table. You should be able to monitor the execution of your lambda and the status of the DynamoDB table through the AWS console.
About On-Demand mode
On-Demand mode is a new addition to AWS that might help ease the pain of managing table capacity. The premise is that the user is now able to pay per request on unknown loads. While this sounds like a very good solution to the same problem, the pricing scheme is different and there’s currently no way to reserve this capacity.
Do you enjoy building high-quality large-scale systems? Roll with Us!